
Generate the COS % audit report
Generate the period COS % Audit Report in Sage Intacct for each Rackson entity, isolate the flagged outlier stores in Excel, and file the workbook.
This process generates the period COS % Audit Report in Sage Intacct for a Rackson entity, exports it to Excel, and isolates the stores whose cost of sales percentage moved outside the expected range. The report highlights outlier stores automatically, and the workbook is then filtered and sorted so those stores rise to the top for review.
Source: Prelim Reports - % COS Audit Report Process Doc - RRS & RCY.docx, with the accompanying recording Prelim Reports - % COS Audit Report - RRS & RCY.mp4 (4m 19s).
Systems: Sage Intacct · Microsoft Excel · SharePoint (Rackson Group Documents)
Before you start
- Access to Sage Intacct for the Rackson top-level entity, with the ability to select the RRS and RCY entities.
- Access to the Rackson Group document library in SharePoint — specifically the entity's
2026 > Period Close > P0X > Financials > Prelimsfolder. - Know the correct period end date before you start. The report prompts for an As of date and defaults to today's date, so this must be changed.
- Two separate report definitions exist, one per entity:
COS % Audit Report - RRSandCOS % Audit Report - RCY. This walkthrough covers RRS — run the same steps a second time for RCY using its own report and its own Prelims folder.
Run this only after the ending inventory workpaper has been posted. The report's current period COS % will not be accurate until the inventory adjustment is in the GL. See Inventory review.
Steps
From the Rackson top-level entity, go to Applications → General Ledger → Financial Reports.
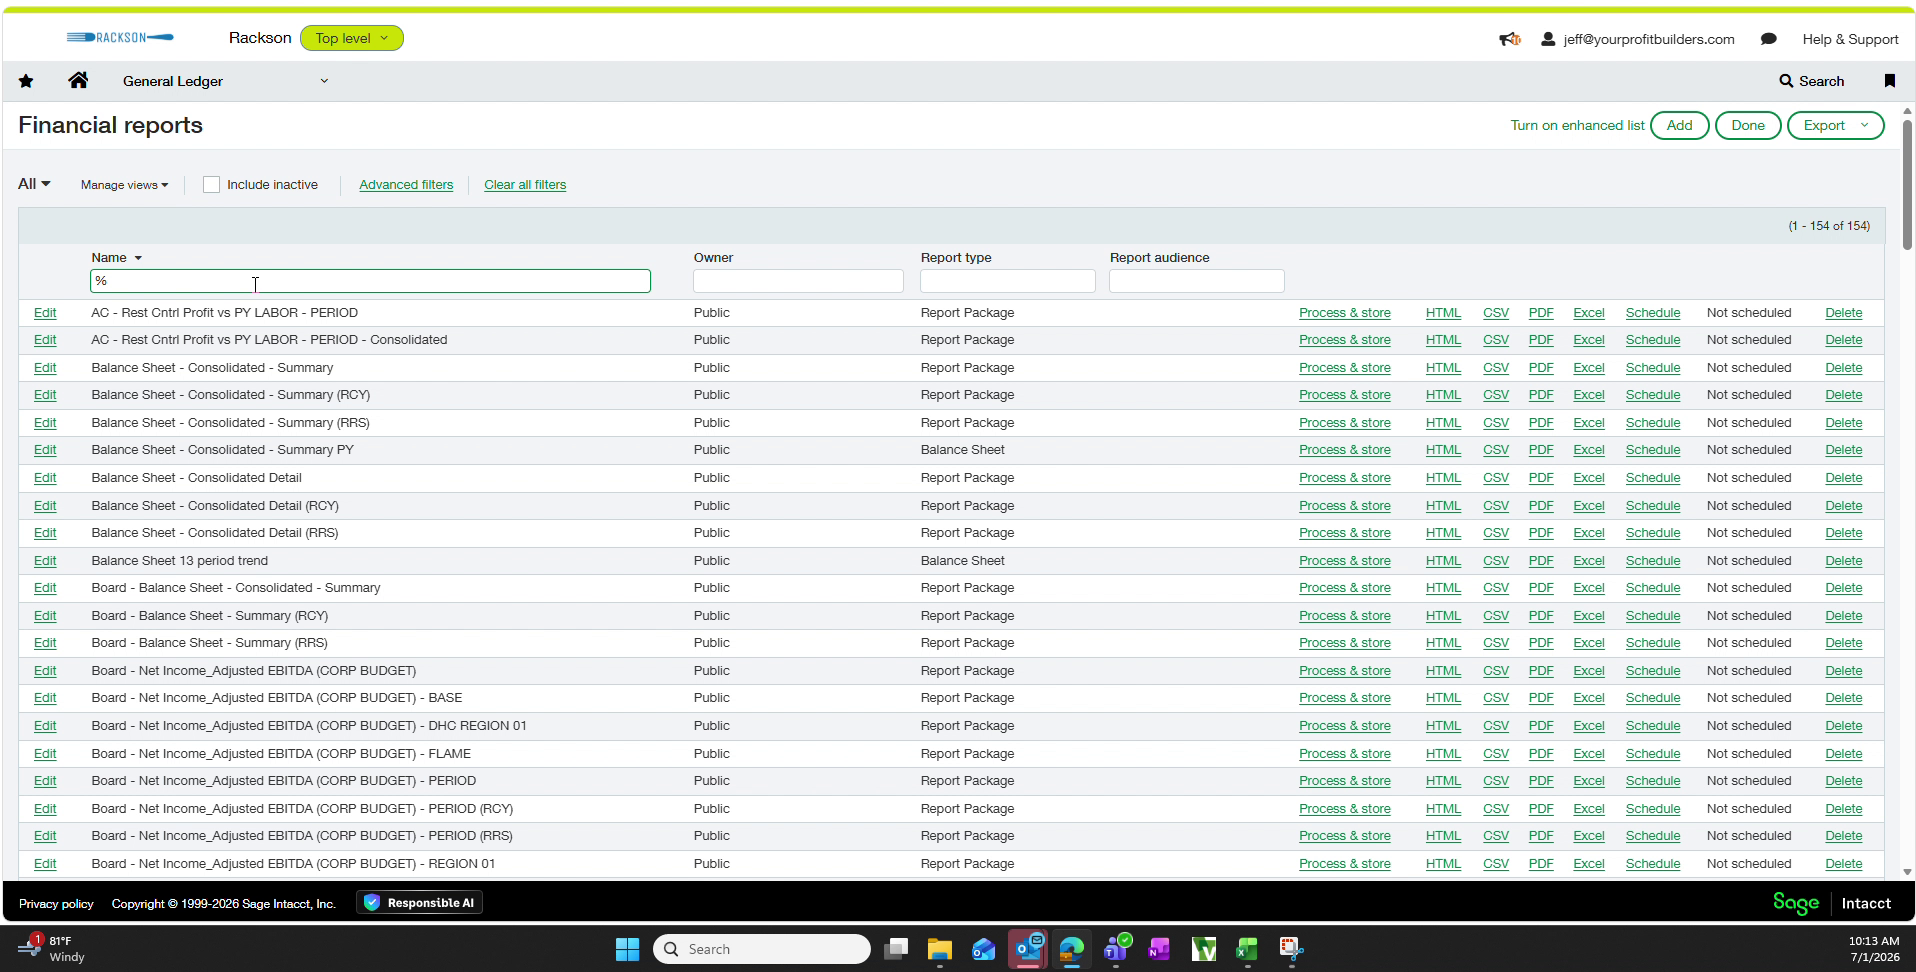
In the Name column filter, type %COS and press Enter. This narrows the list to the two COS % Audit Report definitions — one for RCY and one for RRS.
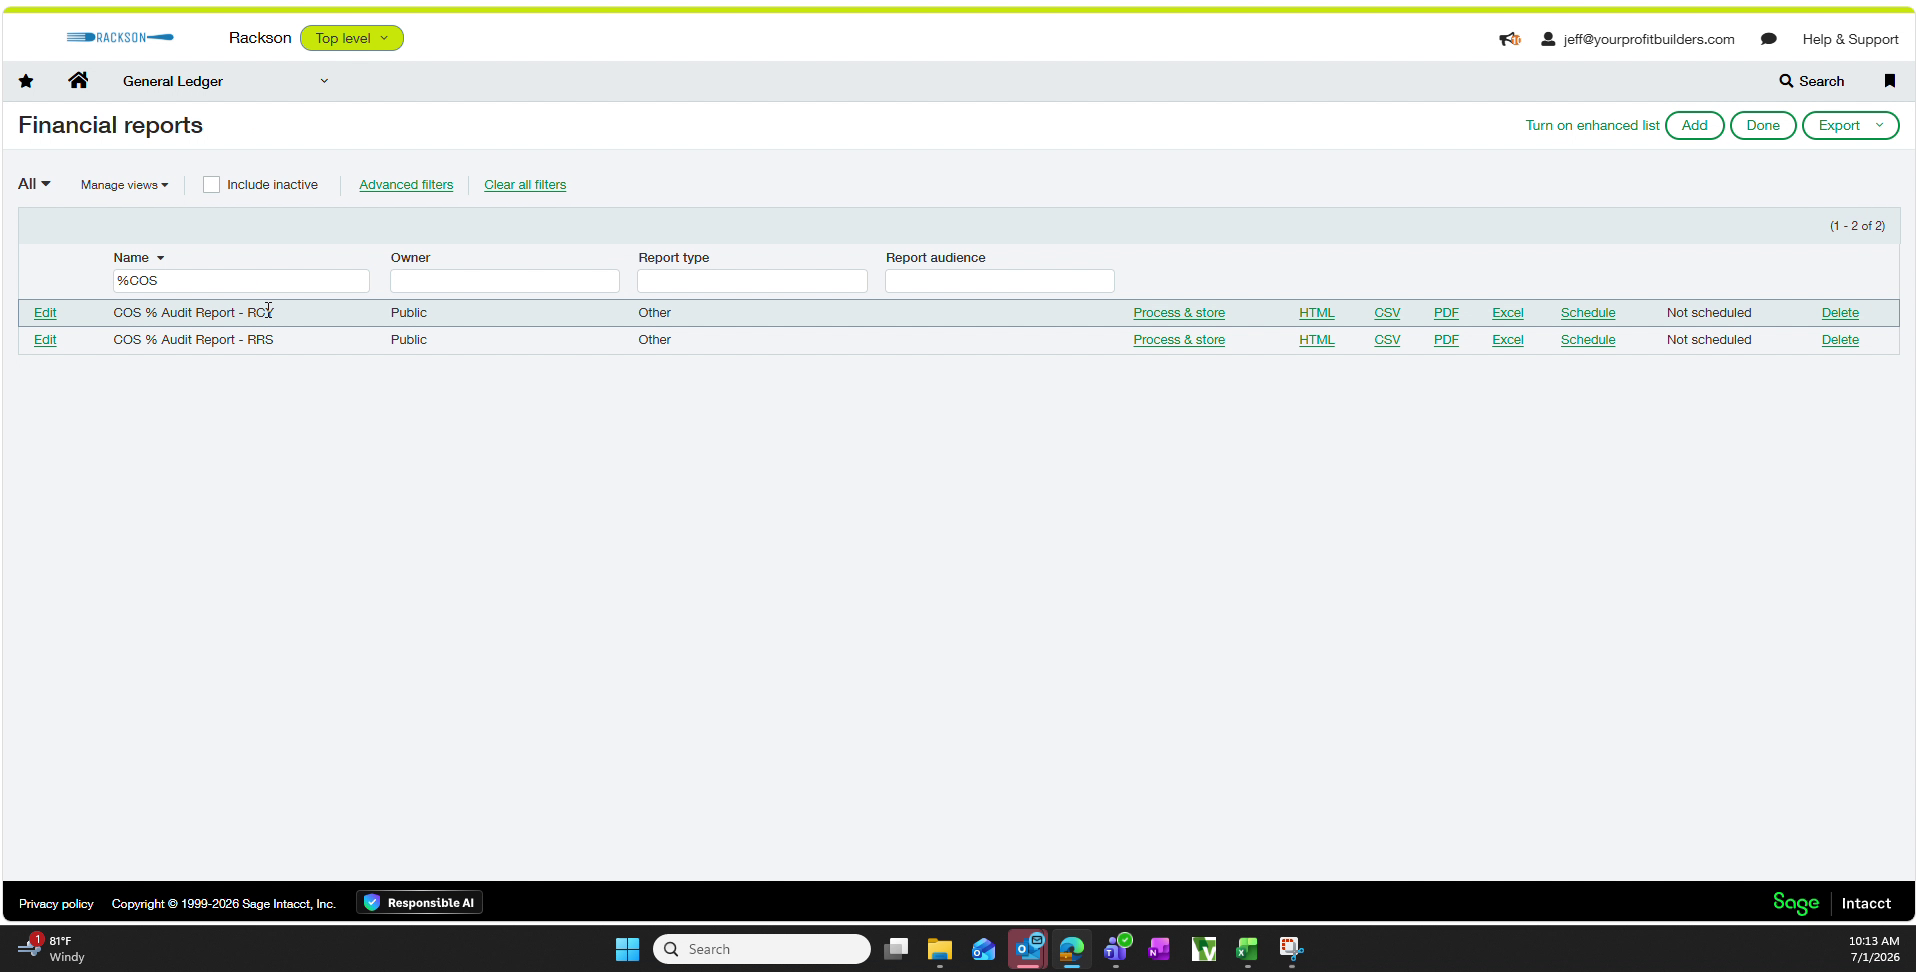
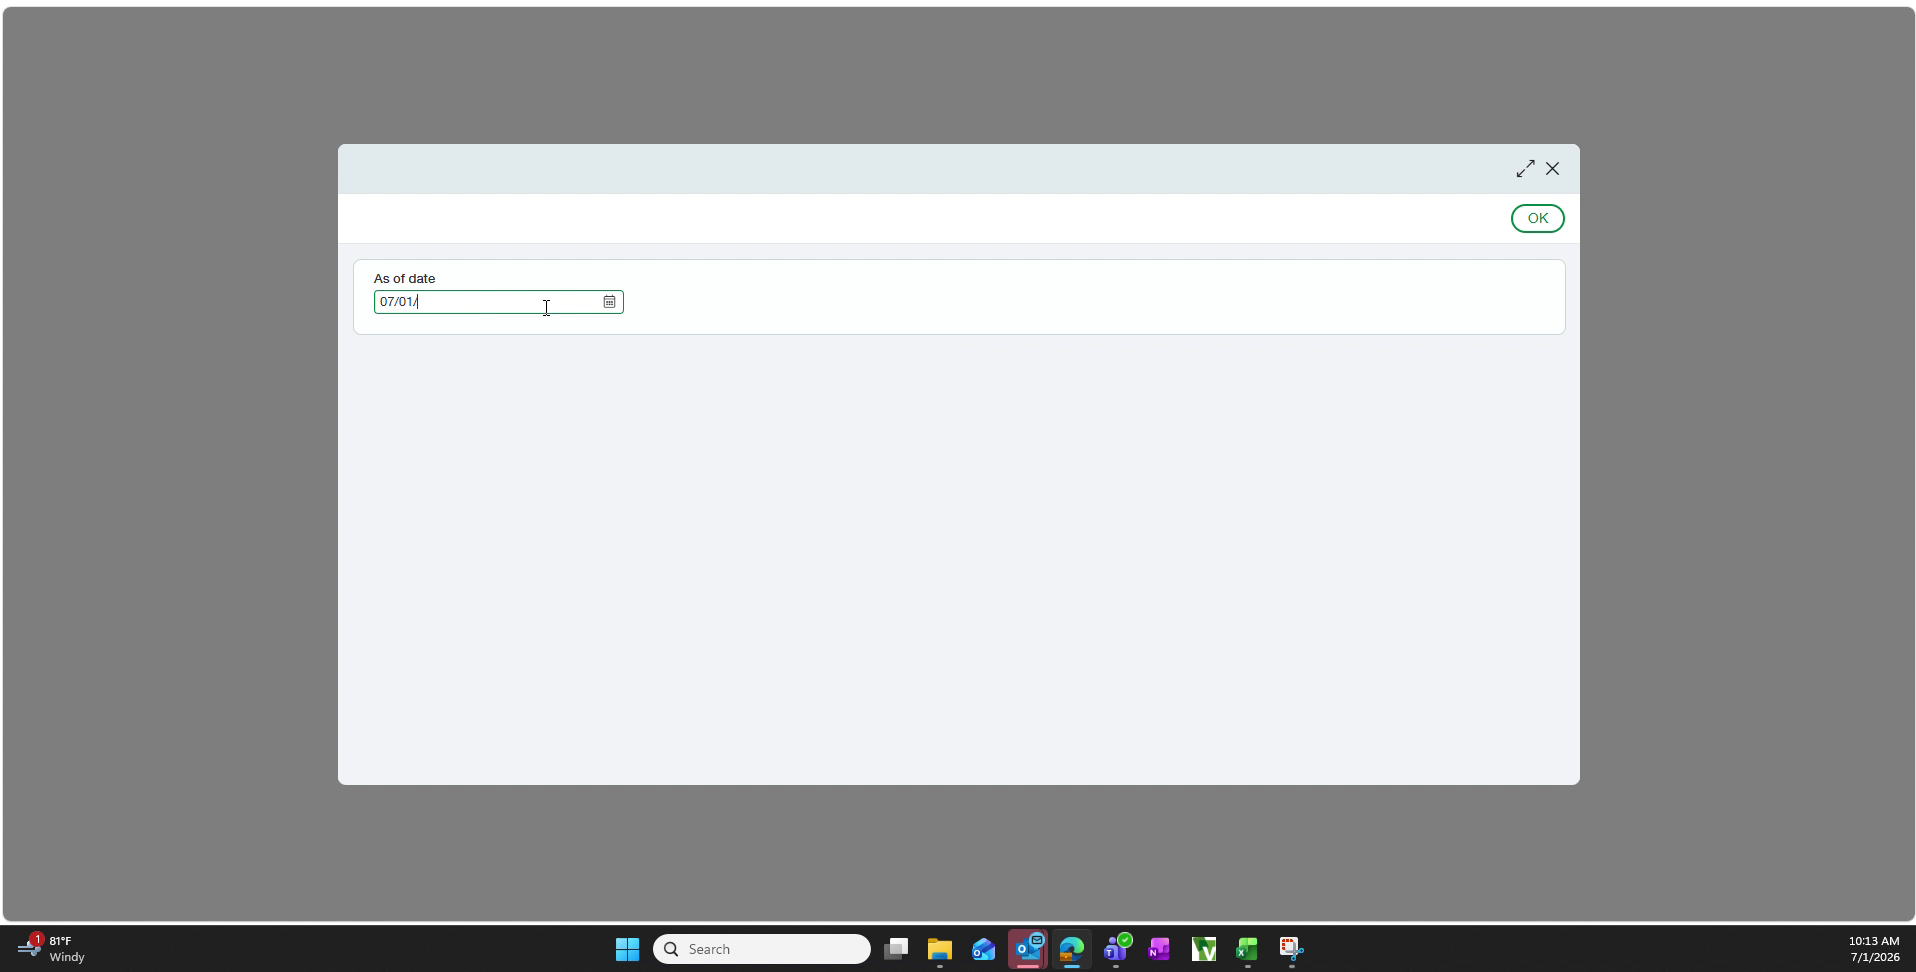
Click Process & store on the row for the entity you are running (RRS in this example). When prompted, clear the default As of date — which is today's date — and enter the actual period end date instead. Click OK.
The As of date field defaults to today's date rather than the period end date. Always overwrite it with the correct period end date before clicking OK, or the report will pull the wrong period.
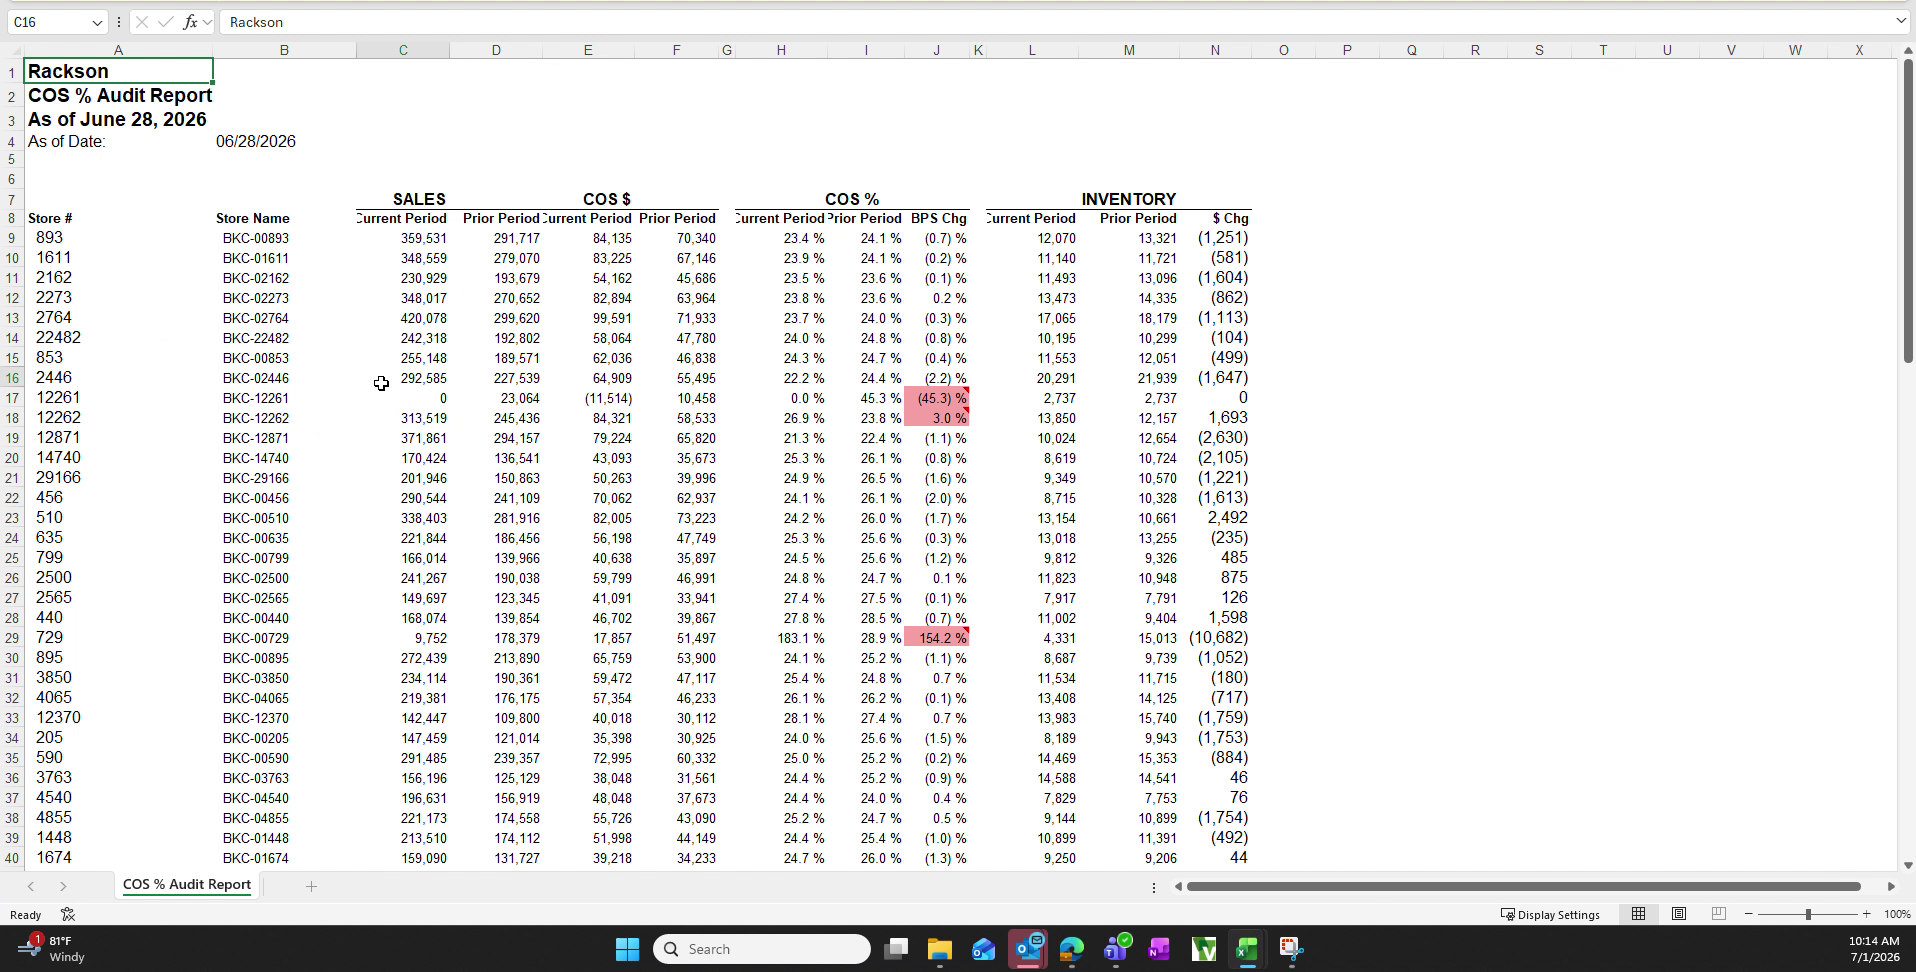
The report opens showing, for every store: current and prior period Sales, COS $, COS %, the basis point change in COS % (BPS Chg), and current and prior period Inventory.
Stores whose BPS Chg falls outside the normal range are automatically shaded pink.
The pink shading is a built-in conditional format keyed to the BPS Chg column, flagging any change of positive 3.0% or greater, or negative 3.0% or less.
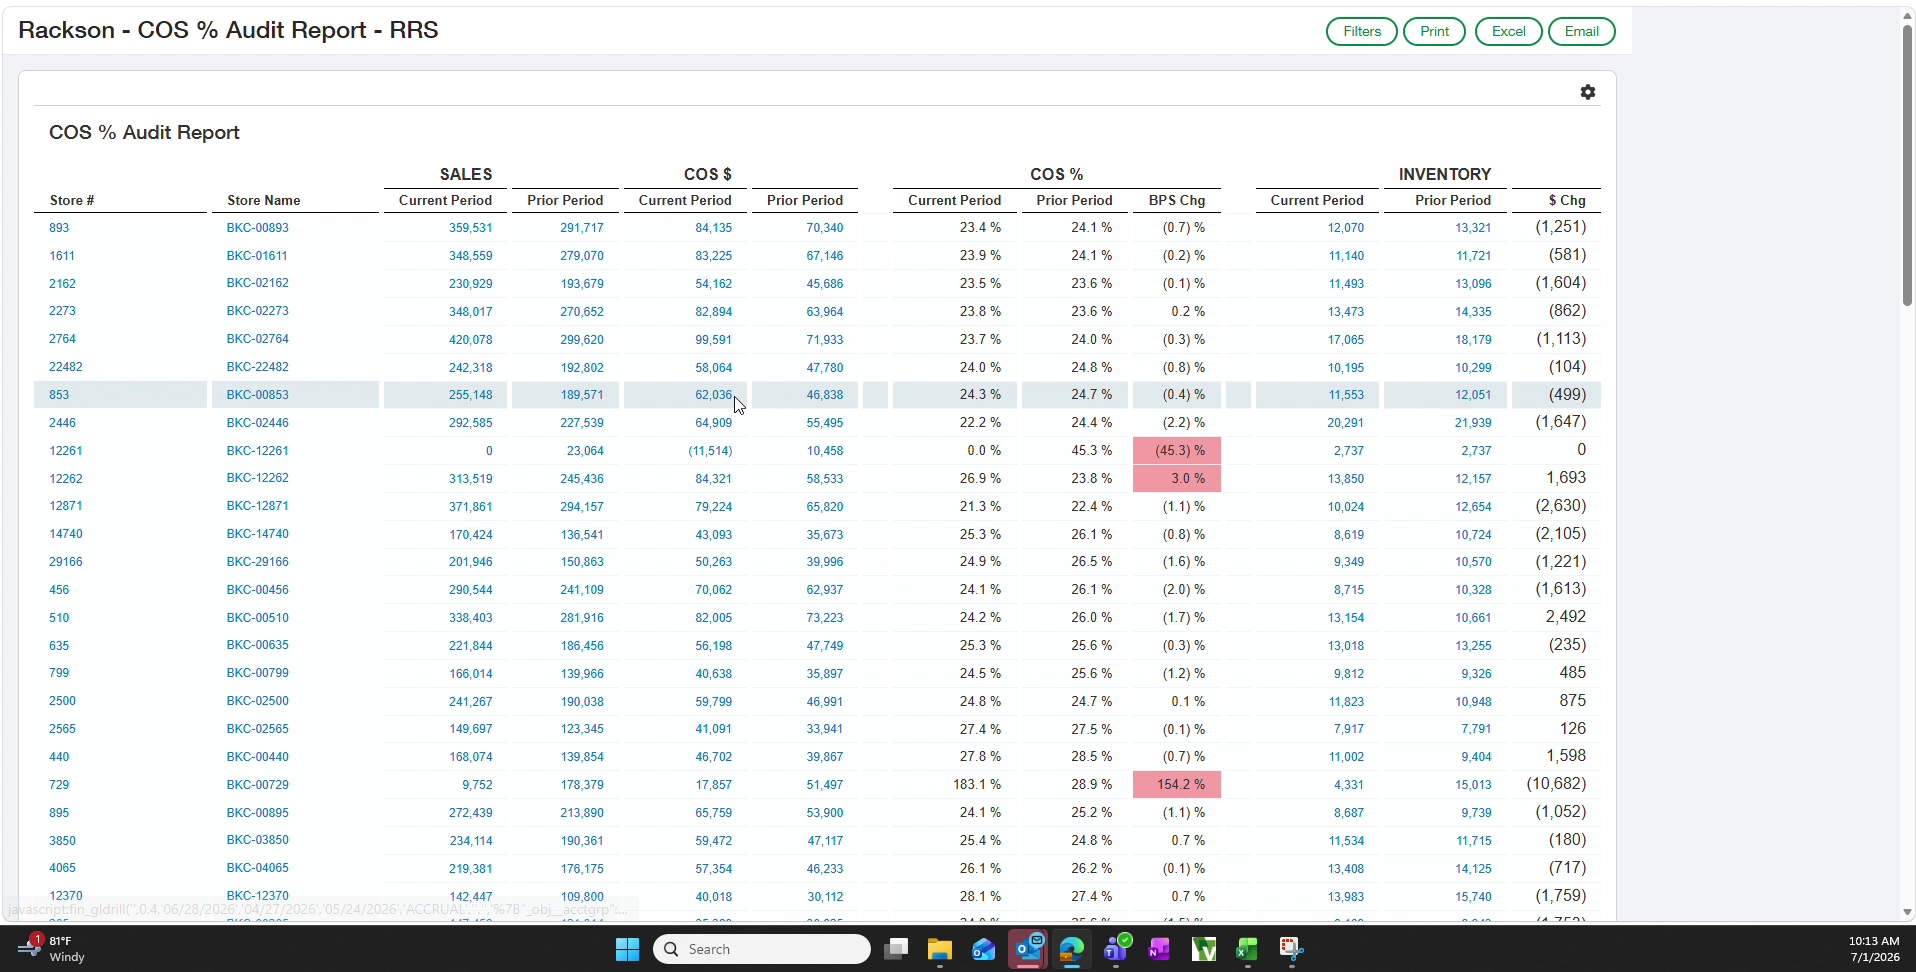
Click Excel in the report toolbar. The exported file carries the report title, the As of date, and the full store-level detail.
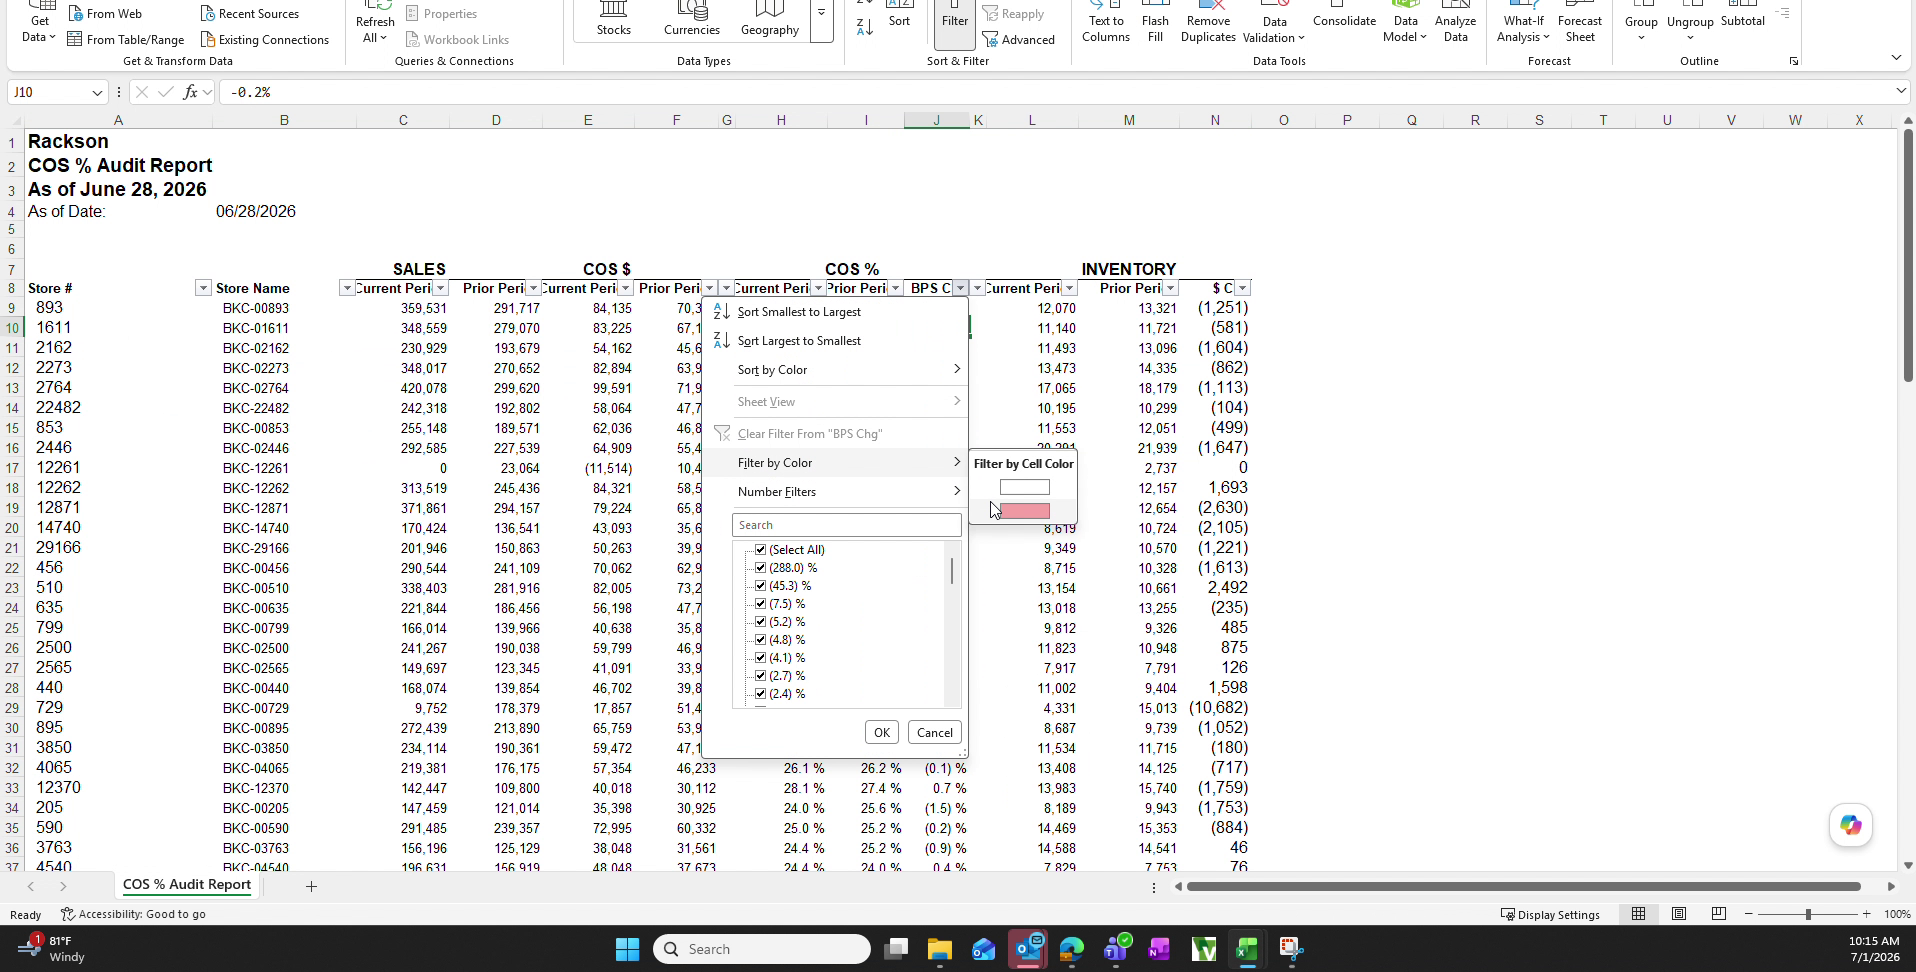
With the workbook open, turn on AutoFilter, click the filter arrow on the BPS Chg column, choose Filter by Color, and select the pink cell colour. This limits the visible rows to only the stores flagged as outliers.
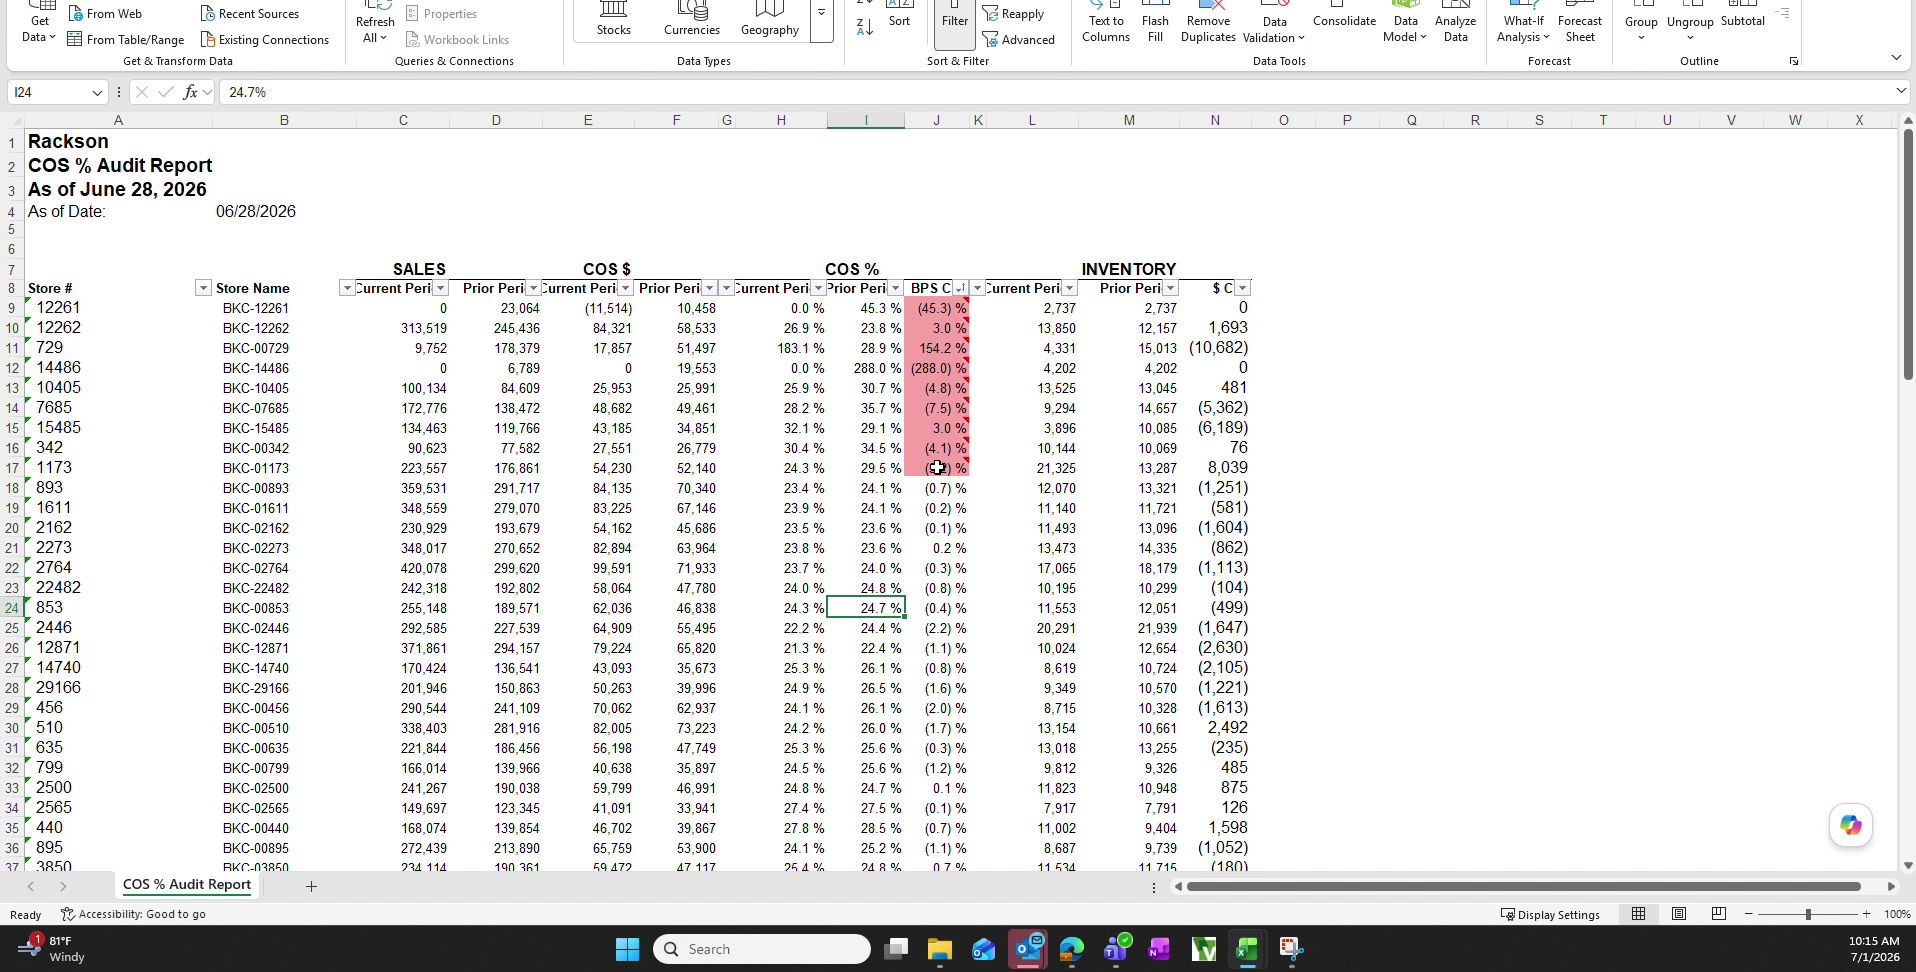
Use Sort by Color on the same column so the pink shaded rows sit at the top of the report, above the remaining stores. This keeps the full store list intact while making the outliers easy to scan and discuss.
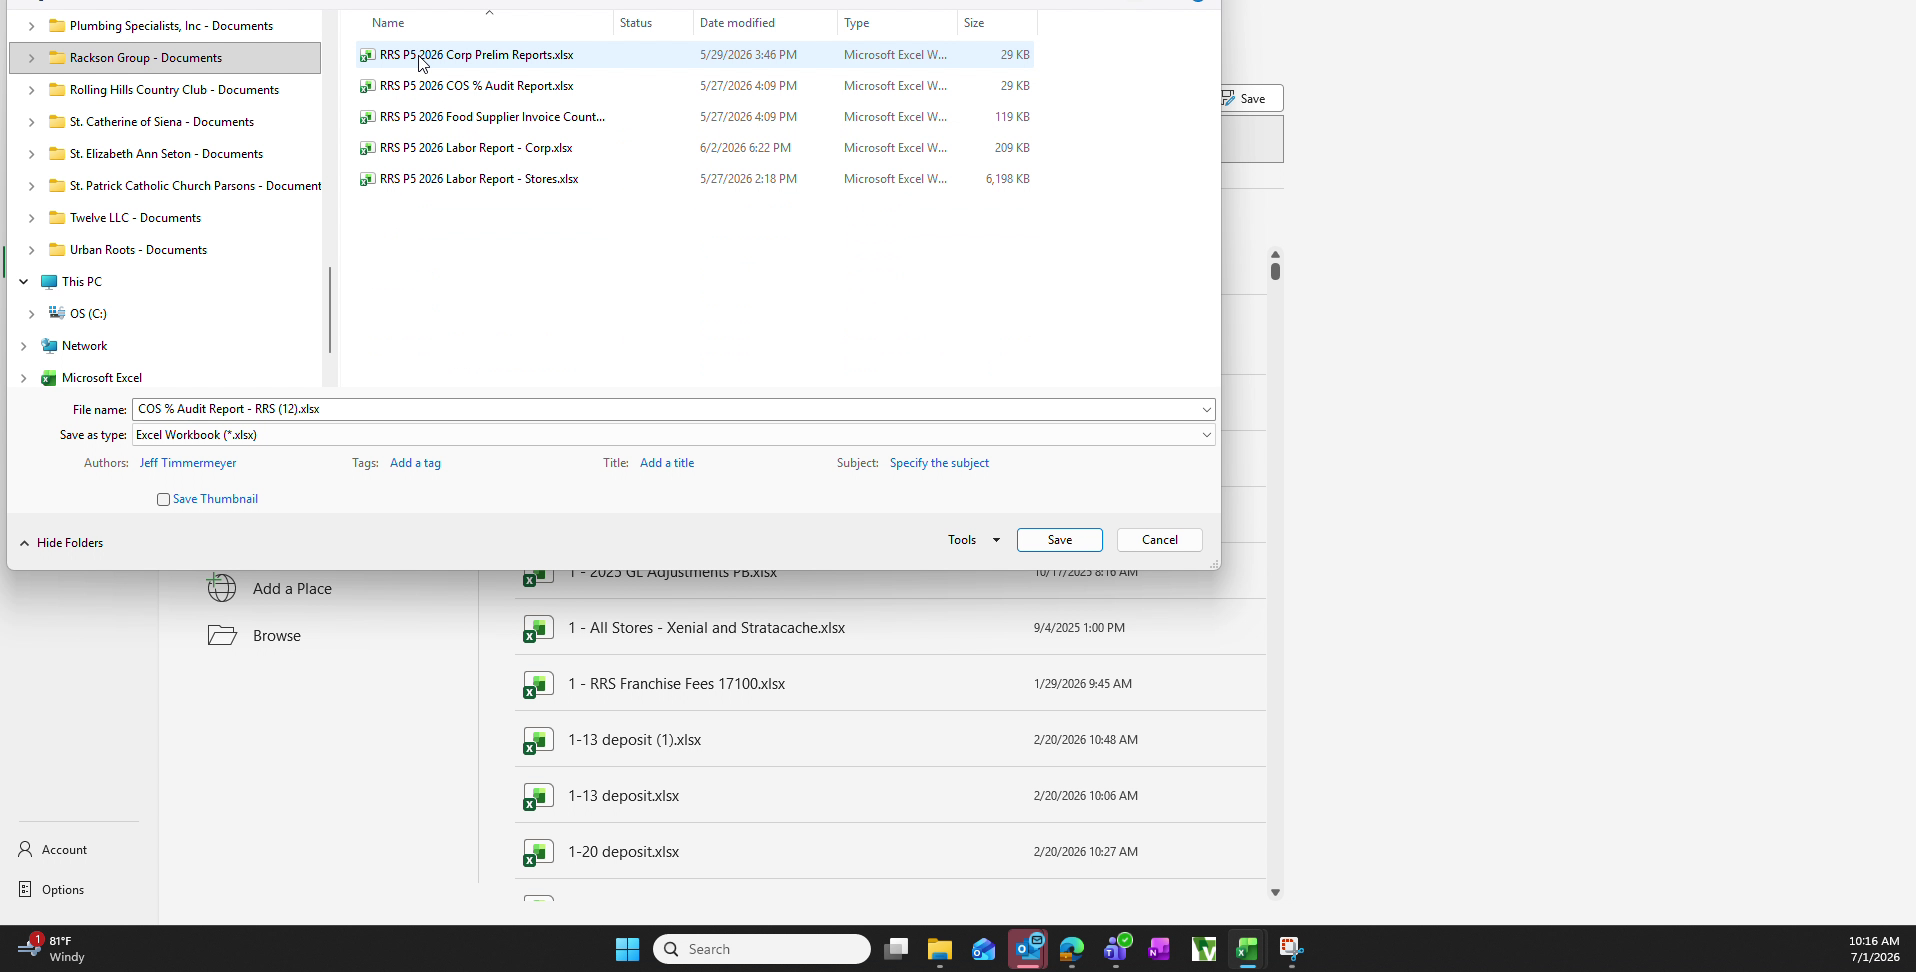
Choose Save As and browse to:
Rackson Group Documents → [entity folder] → 2026
  → Period Close → [current period] → Financials → Prelims
Name the file in the established format — for example RRS P6 2026 COS % Audit Report.xlsx — matching the naming used for the prior period's file in the same folder.
Return to the Financial Reports list and repeat steps 3 through 8 using the COS % Audit Report - RCY definition, saving the resulting workbook into the Rackson Cayenne entity's own Prelims folder with the matching RCY file name.
Summary
Pull the period COS % Audit Report for each Rackson entity from Sage Intacct, use the report's built-in outlier shading together with Excel's colour filter and sort to surface the stores with the largest cost of sales swings, and file the finished workbook in the correct Period Close folder for review.
What to do with the flagged stores — the investigation thresholds, the expected-outlier cases (fire, flood, remodel), and the reconciliation back to the corp prelim — is covered on RRS prelims and RCY prelims.
The report's own conditional format flags at ±3.0%, while the workpaper review guidance flags 300–400 basis points for investigation. The shading is the first pass; the wider band is the reviewer's judgment threshold.
Related
- RRS prelims — the ~145-store BK review and the food supplier invoice count cross-reference
- RCY prelims — the DHC review
- Inventory review — the upstream dependency