---
title: "Sage Intacct financial reporting infrastructure"
sidebarTitle: "Intacct reporting"
description: "How Rackson's 154 Intacct reports are actually built — account groups, the real EBITDA formula, location groups and dimension structures, and what breaks when the P&L structure changes."
icon: "sitemap"
---
> **For AI agents:** the complete documentation index is at [llms.txt](/llms.txt). Append `.md` to any page URL for its markdown version.
This documents how Rackson's Sage Intacct reports are actually built — the underlying structure that the P&L review sits on top of. It exists specifically to answer: **what happens, and what breaks, when the client requests a change to how the P&L or balance sheet is organized.**
**Source:** `Rackson_RRS_RCY_Review_Process.docx` section 48. A companion reference workbook, `Rackson Intacct Financial Report Guide - RRS & RCY.xlsx`, exists on SharePoint and documents the inventory below — several screenshots on this page are from that reference workbook rather than a live Intacct screen, and are labelled accordingly. See [Intacct report guide](/internal/customers/rackson/reference/intacct-report-guide) for the full listing.
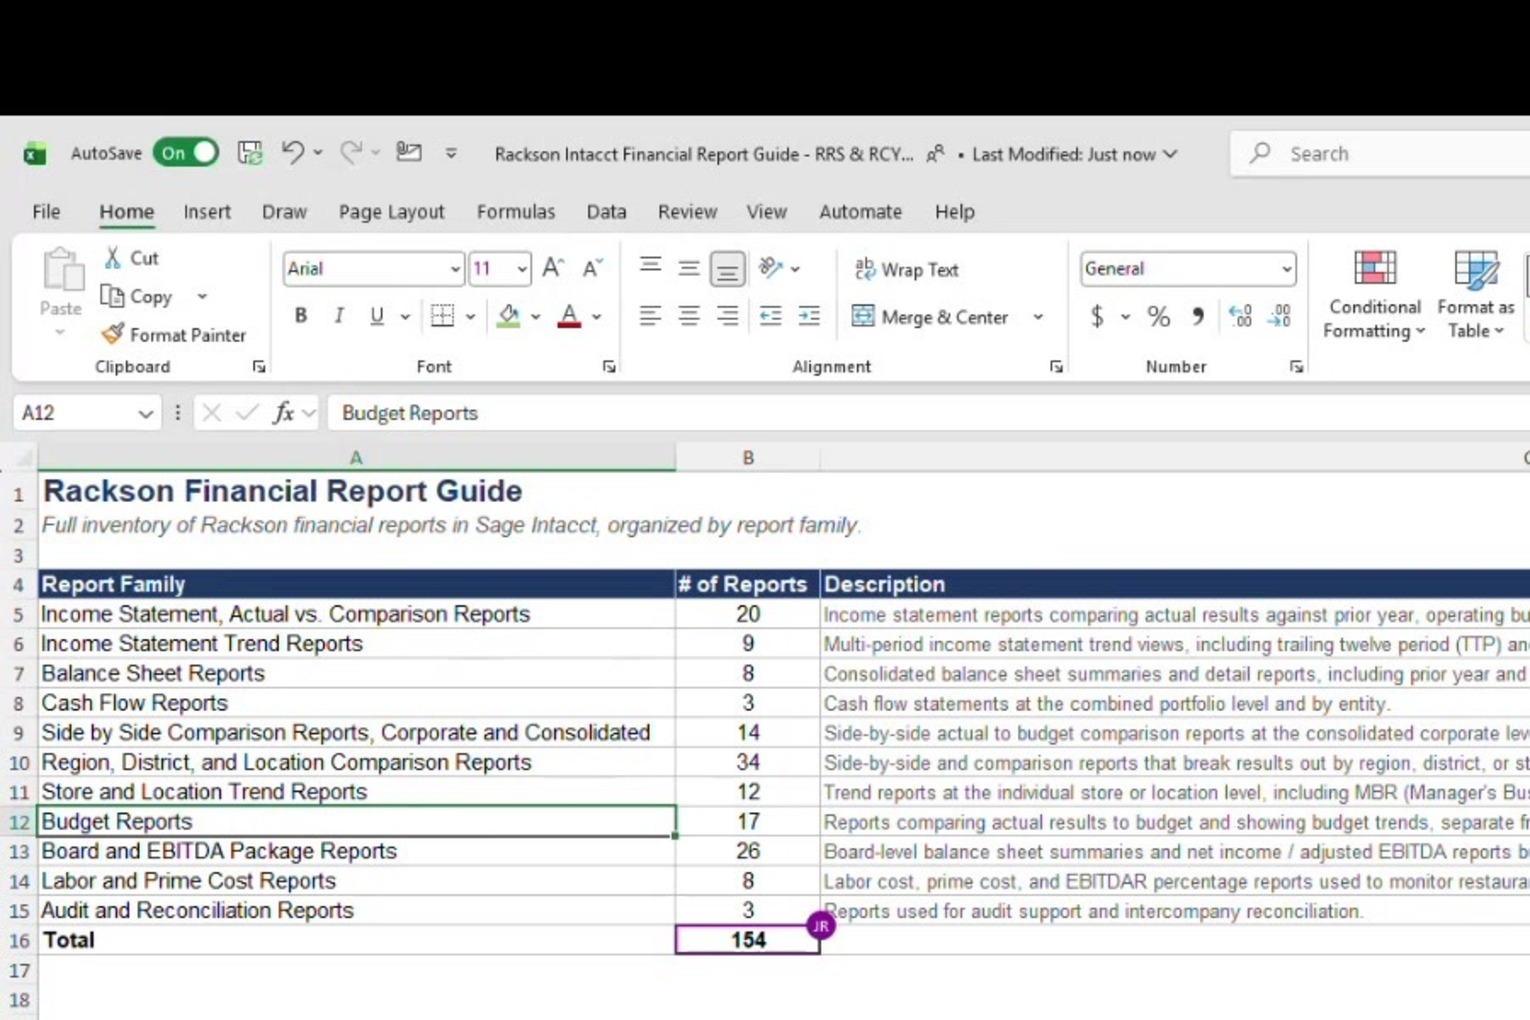
## Full report inventory — 154 reports
| Report family | # of reports |
|---|---|
| Income Statement, Actual vs. Comparison Reports | 20 |
| Income Statement Trend Reports | 9 |
| Balance Sheet Reports | 8 |
| Cash Flow Reports | 3 |
| Side by Side Comparison Reports, Corporate and Consolidated | 14 |
| Region, District, and Location Comparison Reports | 34 |
| Store and Location Trend Reports | 12 |
| Budget Reports | 17 |
| Board and EBITDA Package Reports | 26 |
| Labor and Prime Cost Reports | 8 |
| Audit and Reconciliation Reports | 3 |
| **Total** | **154** |
 ## Account groups — the backbone
**Every balance sheet report** (detail and summary) and **every income statement** (both "basic" and "board" versions) is built off the **same underlying GL account groupings** — not off the report itself. **Change the grouping once, and every report built on it changes.**
### The documented hierarchy
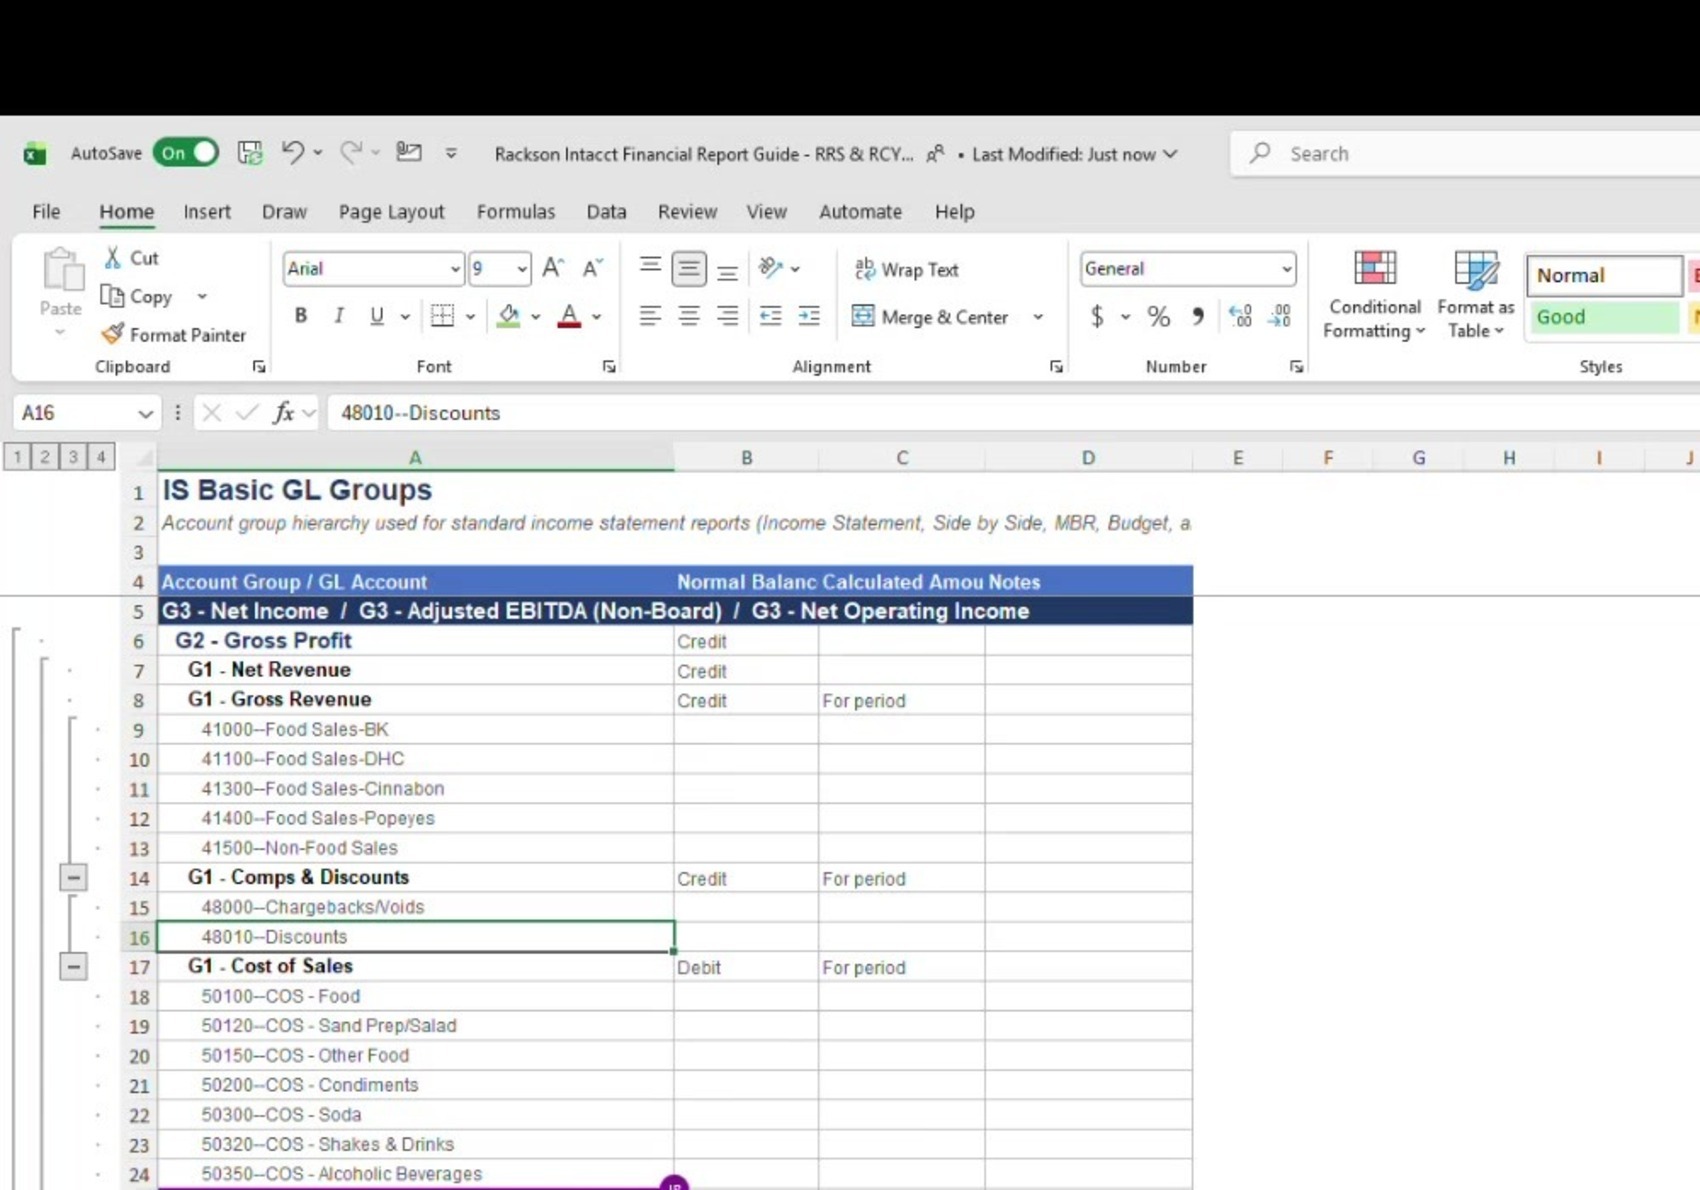
From the reference workbook's **IS Basic GL Groups** tab:
```text
G3 - Net Income
(also aliased as G3 - Adjusted EBITDA (Non-Board) and G3 - Net Operating Income)
└── G2 - Gross Profit
└── G1 - Net Revenue
├── G1 - Gross Revenue
│ 41000 Food Sales-BK · 41100 Food Sales-DHC
│ 41300 Food Sales-Cinnabon · 41400 Food Sales-Popeyes
│ 41500 Non-Food Sales
├── G1 - Comps & Discounts
│ 48000 Chargebacks/Voids · 48010 Discounts
└── G1 - Cost of Sales
50100 COS-Food · 50120 COS-Sand Prep/Salad
50150 COS-Other Food · 50200 COS-Condiments
50300 COS-Soda · 50320 COS-Shakes & Drinks
50350 COS-Alcoholic Beverages · and more
```
**Worth confirming.** The chart of accounts includes Food Sales accounts for **Cinnabon (41300)** and **Popeyes (41400)** in addition to Burger King and Dave's Hot Chicken. Confirm with the engagement lead whether these represent additional concepts inside the current relationship, co-branded/dual-brand locations within RRS, or legacy accounts no longer in active use — the engagement is otherwise scoped to RRS and RCY only. Tracked on [Open items](/internal/customers/rackson/open-items).
### Navigating to an account group
Open the report you're trying to update (e.g. a balance sheet), go to **Edit**, go to **Rows**, and click the small arrow next to the account group/subgroup you want to change, then choose **View**.
This takes you to the same account group screen, just **anchored to the report you were already looking at.**
From the account group edit screen, use the **specified-accounts filter/dropdown** to add the GL account you want included. **Individual accounts or ranges are both supported.**
## Account groups — the backbone
**Every balance sheet report** (detail and summary) and **every income statement** (both "basic" and "board" versions) is built off the **same underlying GL account groupings** — not off the report itself. **Change the grouping once, and every report built on it changes.**
### The documented hierarchy
From the reference workbook's **IS Basic GL Groups** tab:
```text
G3 - Net Income
(also aliased as G3 - Adjusted EBITDA (Non-Board) and G3 - Net Operating Income)
└── G2 - Gross Profit
└── G1 - Net Revenue
├── G1 - Gross Revenue
│ 41000 Food Sales-BK · 41100 Food Sales-DHC
│ 41300 Food Sales-Cinnabon · 41400 Food Sales-Popeyes
│ 41500 Non-Food Sales
├── G1 - Comps & Discounts
│ 48000 Chargebacks/Voids · 48010 Discounts
└── G1 - Cost of Sales
50100 COS-Food · 50120 COS-Sand Prep/Salad
50150 COS-Other Food · 50200 COS-Condiments
50300 COS-Soda · 50320 COS-Shakes & Drinks
50350 COS-Alcoholic Beverages · and more
```
**Worth confirming.** The chart of accounts includes Food Sales accounts for **Cinnabon (41300)** and **Popeyes (41400)** in addition to Burger King and Dave's Hot Chicken. Confirm with the engagement lead whether these represent additional concepts inside the current relationship, co-branded/dual-brand locations within RRS, or legacy accounts no longer in active use — the engagement is otherwise scoped to RRS and RCY only. Tracked on [Open items](/internal/customers/rackson/open-items).
### Navigating to an account group
Open the report you're trying to update (e.g. a balance sheet), go to **Edit**, go to **Rows**, and click the small arrow next to the account group/subgroup you want to change, then choose **View**.
This takes you to the same account group screen, just **anchored to the report you were already looking at.**
From the account group edit screen, use the **specified-accounts filter/dropdown** to add the GL account you want included. **Individual accounts or ranges are both supported.**
 ## Basic vs. board income statements, and the real EBITDA formula
| Type | Behaviour |
|---|---|
| **Basic** (no "board" in the name) | Runs off a single **Net Income** account group and stops there. |
| **Board** | Adds sections **below net income** to build up to an **Adjusted EBITDA** figure, with all of the specific add-back accounts shown. |
### Why EBITDA is built the way it is
**Sage Intacct's report writer cannot sum across rows within a single column** the way a spreadsheet can — it can only combine **column plus column.**
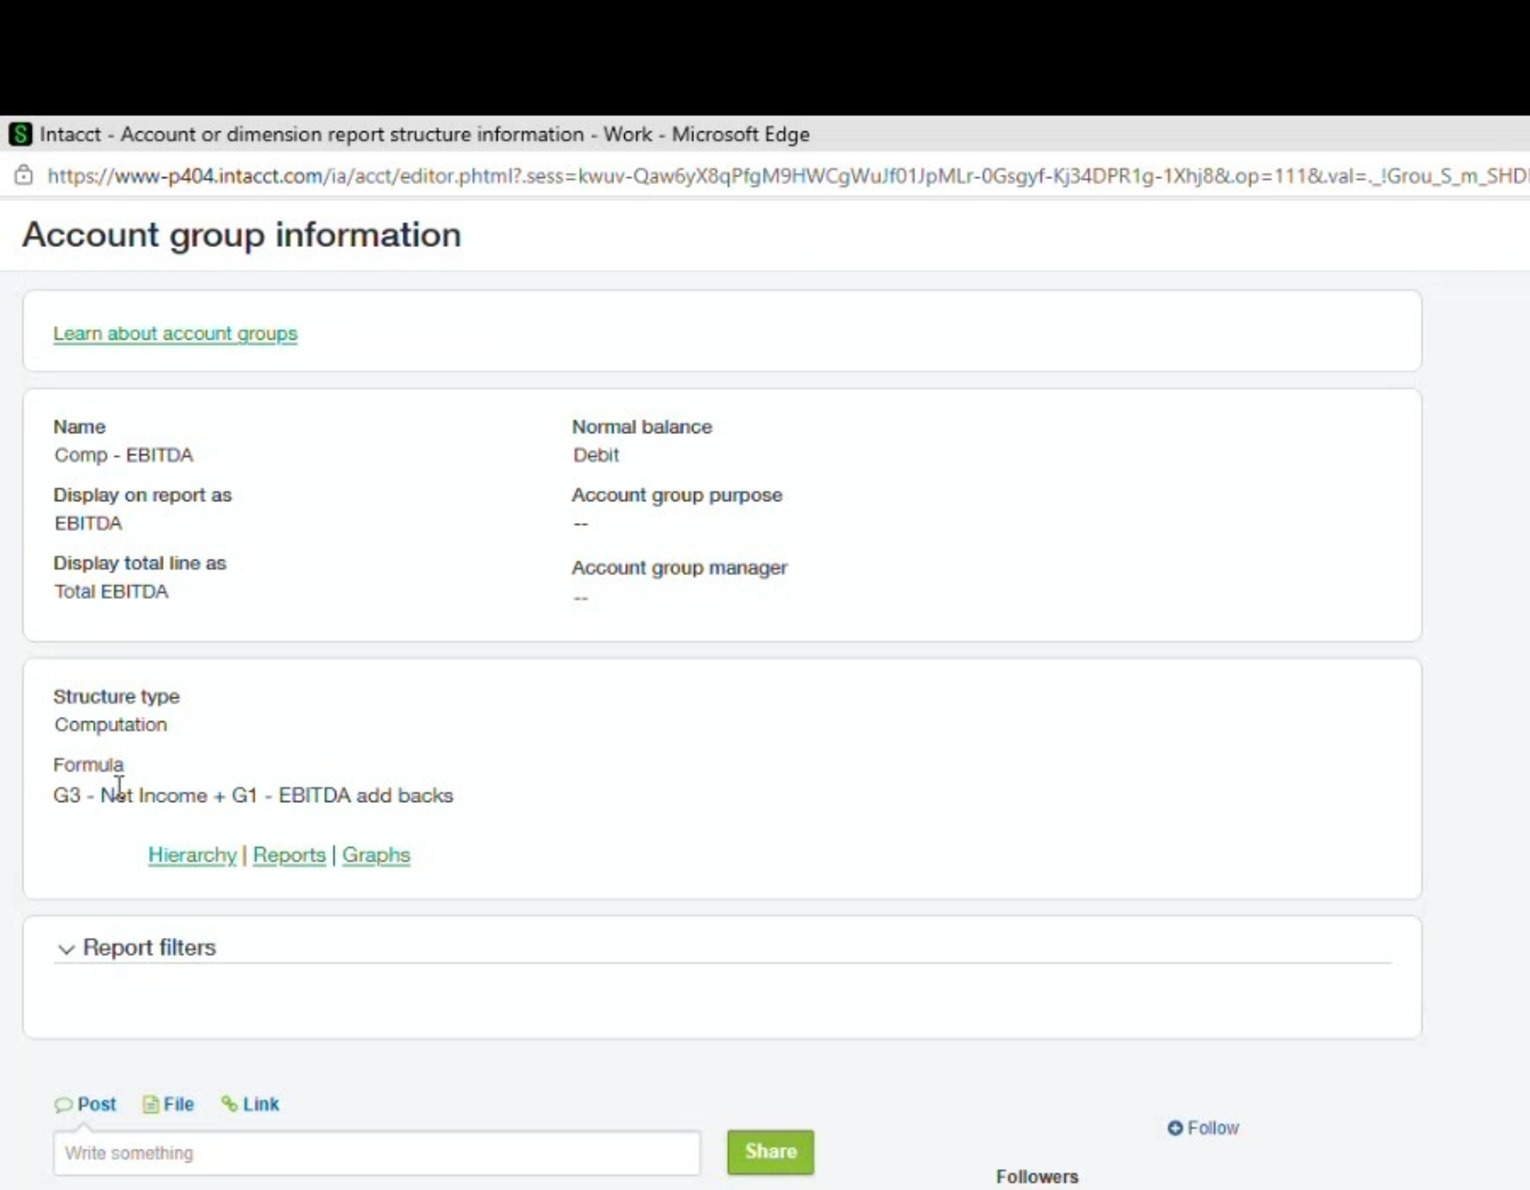
Live Intacct confirms the exact mechanism. The account group named **"Comp - EBITDA"** — displayed on reports as "EBITDA," with its total line displayed as "Total EBITDA" — has a **Structure Type of "Computation"** and an actual formula of:
```text
G3 - Net Income + G1 - EBITDA add backs
```
In other words, **EBITDA is literally built by adding one existing account group (Net Income) to another** (a group that itself just lists the specific add-back GL accounts) — not a spreadsheet-style SUM.
**This was a deliberate choice, not a limitation the team is stuck with.** Showing the actual GL accounts that make up each add-back is treated as a **control** — so anyone can see exactly which accounts are included in the EBITDA build-up and challenge or adjust it account by account, rather than trusting an opaque single number no one is reconciling.
Because the Adjusted EBITDA build had to be added to **both** the board and the basic income statement formats, **both structures now include it.** Confirm this stays true if new board sections are added in future.
## Basic vs. board income statements, and the real EBITDA formula
| Type | Behaviour |
|---|---|
| **Basic** (no "board" in the name) | Runs off a single **Net Income** account group and stops there. |
| **Board** | Adds sections **below net income** to build up to an **Adjusted EBITDA** figure, with all of the specific add-back accounts shown. |
### Why EBITDA is built the way it is
**Sage Intacct's report writer cannot sum across rows within a single column** the way a spreadsheet can — it can only combine **column plus column.**
Live Intacct confirms the exact mechanism. The account group named **"Comp - EBITDA"** — displayed on reports as "EBITDA," with its total line displayed as "Total EBITDA" — has a **Structure Type of "Computation"** and an actual formula of:
```text
G3 - Net Income + G1 - EBITDA add backs
```
In other words, **EBITDA is literally built by adding one existing account group (Net Income) to another** (a group that itself just lists the specific add-back GL accounts) — not a spreadsheet-style SUM.
**This was a deliberate choice, not a limitation the team is stuck with.** Showing the actual GL accounts that make up each add-back is treated as a **control** — so anyone can see exactly which accounts are included in the EBITDA build-up and challenge or adjust it account by account, rather than trusting an opaque single number no one is reconciling.
Because the Adjusted EBITDA build had to be added to **both** the board and the basic income statement formats, **both structures now include it.** Confirm this stays true if new board sections are added in future.
 ## What breaks — and what doesn't — when the P&L structure changes
| Change | Risk |
|---|---|
| **Moving an individual GL account** from one existing account group/subgroup to another (e.g. Cost of Sales → Comps & Discounts) | **Low.** Does not require reformatting every report that uses that group. |
| **Adding a brand-new subtotal/account group**, or restructuring an existing subgroup | **High.** **Resets formatting on every single report that references that account group** — spacing, underlines, and blank/heading rows all get wiped out and must be manually rebuilt, one report at a time. |
**Screenshot first.** Before making a structural change, take a screenshot of the **Format tab (rows and totals)** for a report that already looks the way you want, so you have a reference to rebuild every affected report against afterward.
**Always preview in PDF, not HTML.** After making the change, pull each affected report as a **PDF** to check formatting. **HTML preview does not reliably show blank rows/spacing** the way the final PDF/Excel output will — so formatting problems can be invisible in HTML and only show up once the report is actually delivered.
**Practical workflow for a larger change.** Because the same underlying account groups feed potentially dozens of saved reports — up to **34** for the Region/District/Location comparison family alone — first pull a list of every P&L report that will be affected and **use that list as your own checklist** while fixing formatting one by one.
**Balance sheet reports (only 8 total) are much lower-risk** for this kind of disruption than income statement or board changes.
## Location groups and dimension structures
| Concept | Definition |
|---|---|
| **Location group** | A named list of specific store locations. **The raw building blocks.** |
| **Dimension structure** | A hierarchy built by grouping location groups together — e.g. a "region" dimension structure is made up of several "pod" location groups, and each pod is made up of specific individual stores. |
### The "Used in a Structure?" column
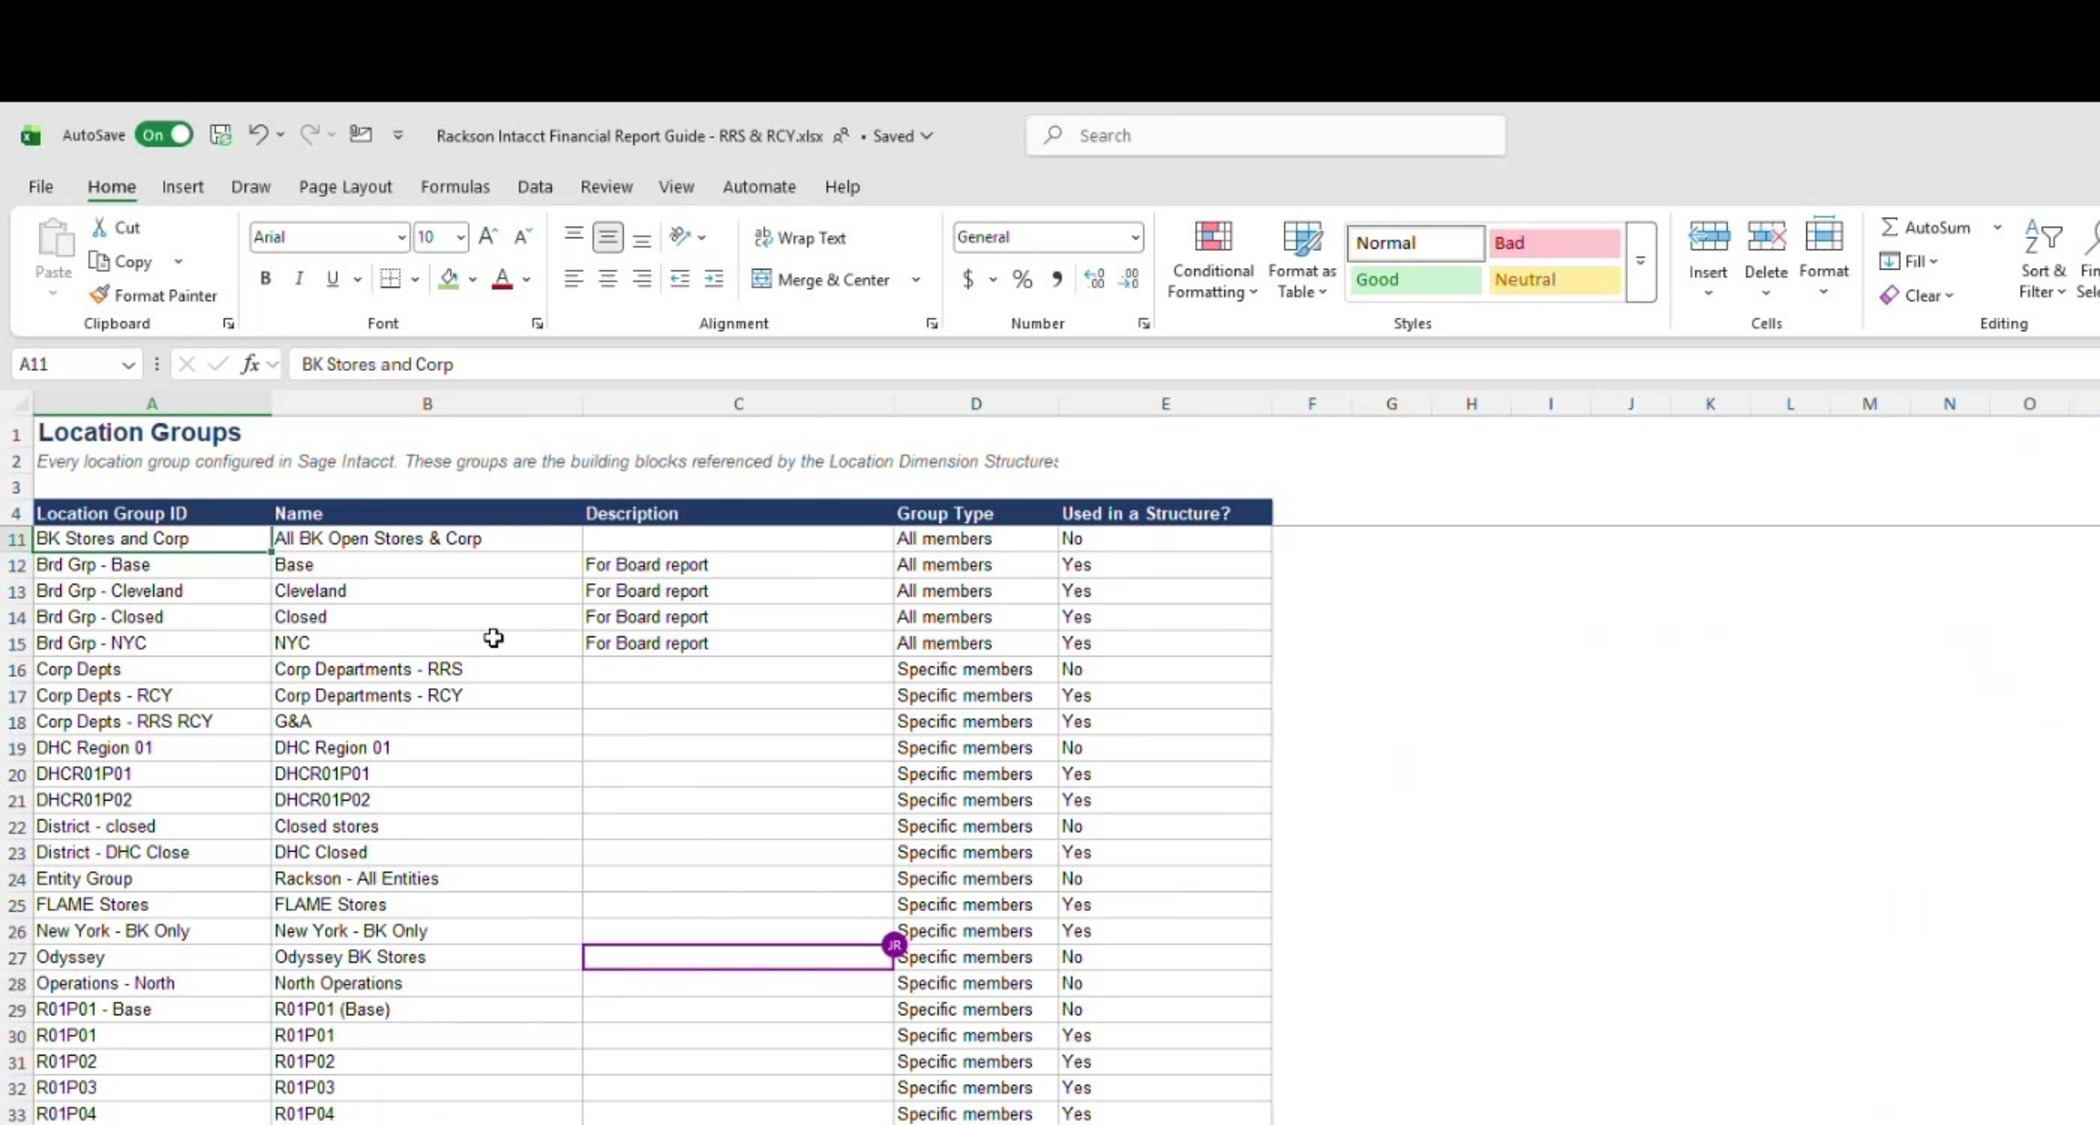
The reference workbook's **Location Groups** tab lists every group configured in Intacct, with a **"Used in a Structure?"** column flagging whether each is actually wired into a dimension structure (and therefore feeding live reports) or is an orphaned/legacy ("boneyard") group.
Real examples from that list:
| Group | Notes |
|---|---|
| **BK Stores and Corp** | All BK Open Stores & Corp — **not used in a structure** |
| **Brd Grp - Base / Cleveland / Closed / NYC** | All "For Board report," all used |
| **Corp Depts - RRS / RCY / RRS RCY** | The last displayed as "G&A" |
| **DHC Region 01** + pods `DHCR01P01` / `DHCR01P02` | DHC = Dave's Hot Chicken, i.e. the RCY side |
| **District - closed** / **District - DHC Close** | — |
| **Entity Group** | Rackson - All Entities |
| **FLAME Stores** · **Odyssey** (Odyssey BK Stores) | Legacy acquisition-era groupings |
| **New York - BK Only** | — |
| **Operations - North** (North Operations) | Naming pair the team **wasn't confident was still accurate or in use** |
| **R01P01 through at least R01P04** | The RRS pods |
**"FLAME Stores" and "Odyssey"** correspond to the legacy "base and flame store" acquisition-related groupings — both tied to older acquisitions and **generally not the groups to use for current-day allocations.** Check the "Used in a Structure?" column before spending time on one, and don't assume every group in the listing is still actively maintained.
**Annotation practice going forward.** Actively-used groups are being annotated in their **Description** field with a short note on why they exist and what report(s) rely on them — specifically so a new reviewer doesn't have to guess or reverse-engineer old naming conventions.
### New-store setup is manual, one group at a time
When a new store opens (or an existing store needs to move between pods/districts), it must be **manually added to every relevant location group, one at a time.** There is **no bulk or automatic "add to all" option.**
A location group set to pull in "all members" of an entity **will include locations with zero activity**, which can clutter reports that are supposed to auto-hide blank rows but do not always do so reliably.
### Moving a store between pods
The dimension structure and everything built on it **reflects the change automatically** once the underlying location groups are updated — **you do not need to touch the dimension structure itself** for a simple store-to-pod reassignment.
## What breaks — and what doesn't — when the P&L structure changes
| Change | Risk |
|---|---|
| **Moving an individual GL account** from one existing account group/subgroup to another (e.g. Cost of Sales → Comps & Discounts) | **Low.** Does not require reformatting every report that uses that group. |
| **Adding a brand-new subtotal/account group**, or restructuring an existing subgroup | **High.** **Resets formatting on every single report that references that account group** — spacing, underlines, and blank/heading rows all get wiped out and must be manually rebuilt, one report at a time. |
**Screenshot first.** Before making a structural change, take a screenshot of the **Format tab (rows and totals)** for a report that already looks the way you want, so you have a reference to rebuild every affected report against afterward.
**Always preview in PDF, not HTML.** After making the change, pull each affected report as a **PDF** to check formatting. **HTML preview does not reliably show blank rows/spacing** the way the final PDF/Excel output will — so formatting problems can be invisible in HTML and only show up once the report is actually delivered.
**Practical workflow for a larger change.** Because the same underlying account groups feed potentially dozens of saved reports — up to **34** for the Region/District/Location comparison family alone — first pull a list of every P&L report that will be affected and **use that list as your own checklist** while fixing formatting one by one.
**Balance sheet reports (only 8 total) are much lower-risk** for this kind of disruption than income statement or board changes.
## Location groups and dimension structures
| Concept | Definition |
|---|---|
| **Location group** | A named list of specific store locations. **The raw building blocks.** |
| **Dimension structure** | A hierarchy built by grouping location groups together — e.g. a "region" dimension structure is made up of several "pod" location groups, and each pod is made up of specific individual stores. |
### The "Used in a Structure?" column
The reference workbook's **Location Groups** tab lists every group configured in Intacct, with a **"Used in a Structure?"** column flagging whether each is actually wired into a dimension structure (and therefore feeding live reports) or is an orphaned/legacy ("boneyard") group.
Real examples from that list:
| Group | Notes |
|---|---|
| **BK Stores and Corp** | All BK Open Stores & Corp — **not used in a structure** |
| **Brd Grp - Base / Cleveland / Closed / NYC** | All "For Board report," all used |
| **Corp Depts - RRS / RCY / RRS RCY** | The last displayed as "G&A" |
| **DHC Region 01** + pods `DHCR01P01` / `DHCR01P02` | DHC = Dave's Hot Chicken, i.e. the RCY side |
| **District - closed** / **District - DHC Close** | — |
| **Entity Group** | Rackson - All Entities |
| **FLAME Stores** · **Odyssey** (Odyssey BK Stores) | Legacy acquisition-era groupings |
| **New York - BK Only** | — |
| **Operations - North** (North Operations) | Naming pair the team **wasn't confident was still accurate or in use** |
| **R01P01 through at least R01P04** | The RRS pods |
**"FLAME Stores" and "Odyssey"** correspond to the legacy "base and flame store" acquisition-related groupings — both tied to older acquisitions and **generally not the groups to use for current-day allocations.** Check the "Used in a Structure?" column before spending time on one, and don't assume every group in the listing is still actively maintained.
**Annotation practice going forward.** Actively-used groups are being annotated in their **Description** field with a short note on why they exist and what report(s) rely on them — specifically so a new reviewer doesn't have to guess or reverse-engineer old naming conventions.
### New-store setup is manual, one group at a time
When a new store opens (or an existing store needs to move between pods/districts), it must be **manually added to every relevant location group, one at a time.** There is **no bulk or automatic "add to all" option.**
A location group set to pull in "all members" of an entity **will include locations with zero activity**, which can clutter reports that are supposed to auto-hide blank rows but do not always do so reliably.
### Moving a store between pods
The dimension structure and everything built on it **reflects the change automatically** once the underlying location groups are updated — **you do not need to touch the dimension structure itself** for a simple store-to-pod reassignment.
 ## Building a report on a dimension structure
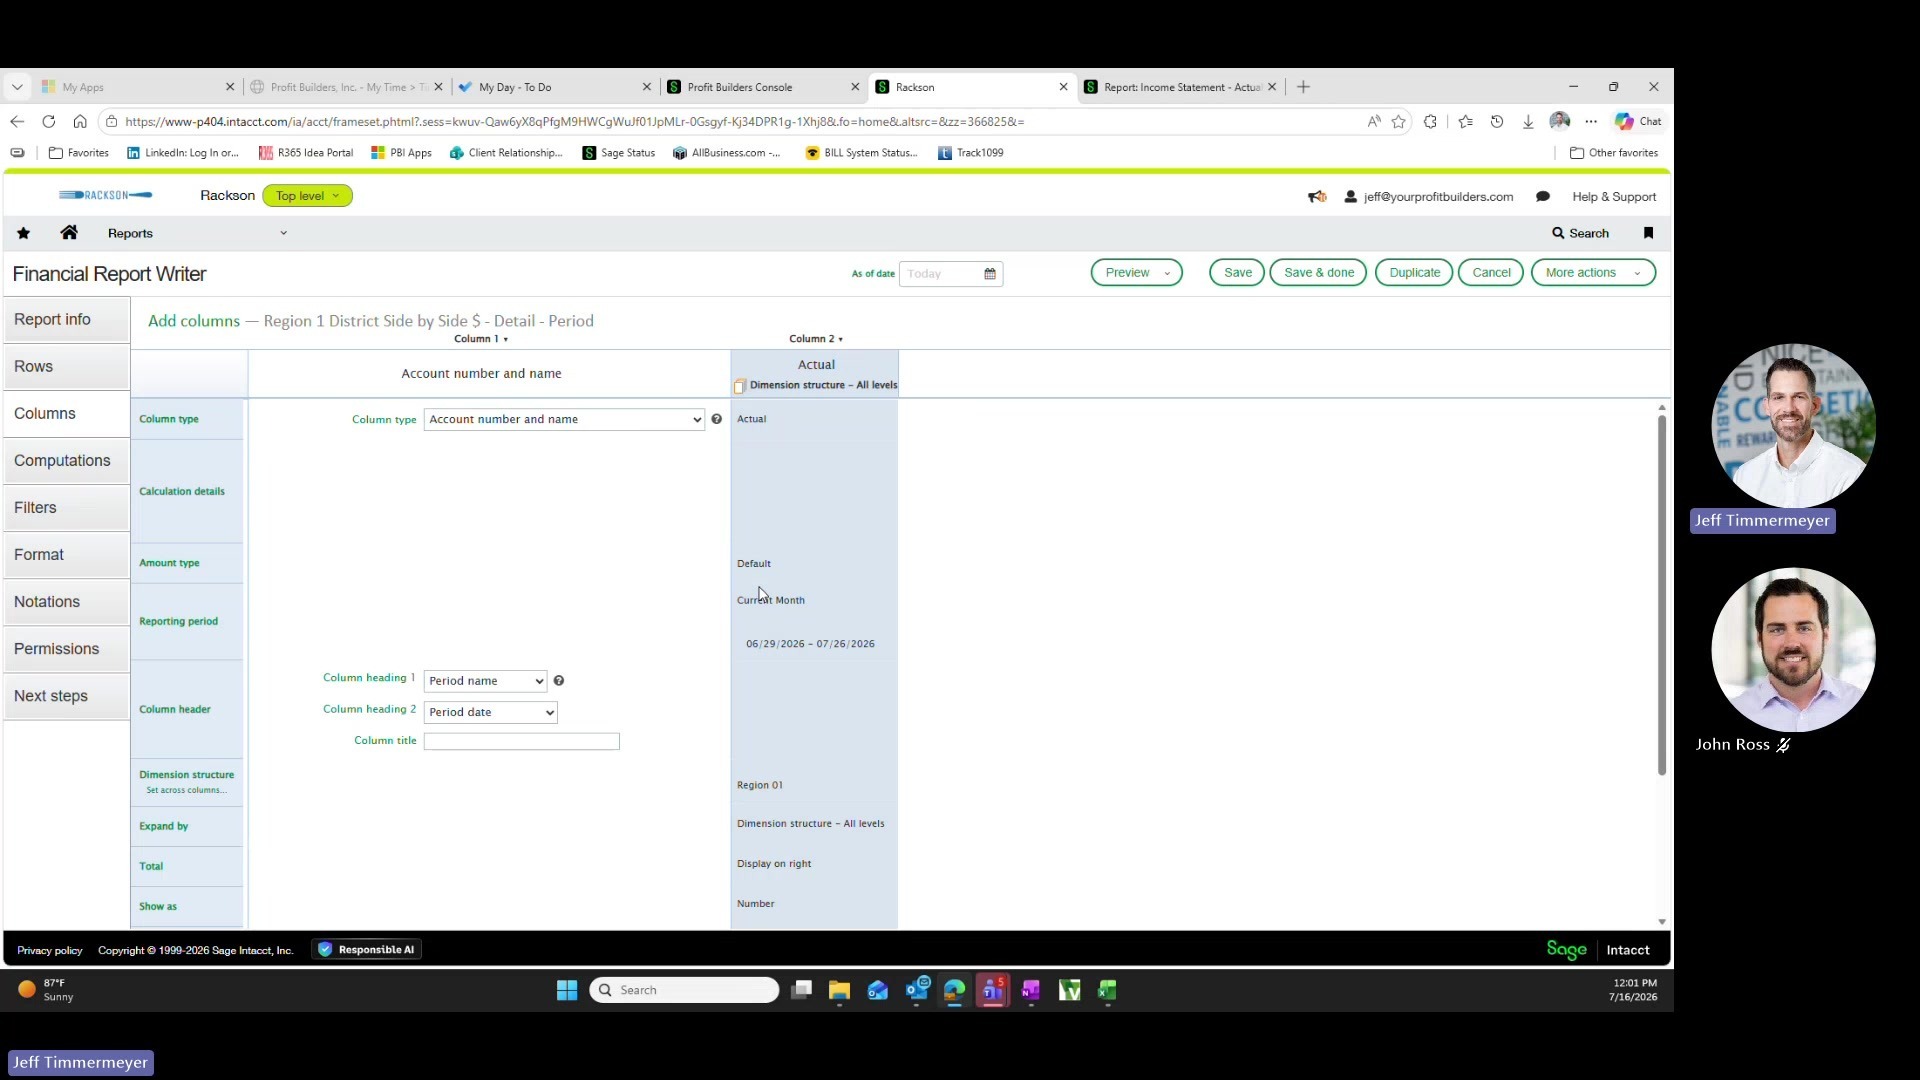
For example a regional side-by-side:
E.g. the current-period actual-dollars column.
To split that single column by a **dimension structure** — as opposed to expanding by **time period**, which is used for reports showing multiple months across the columns instead.
Choose **Dimension Structure** when you want the report to show a **level of the hierarchy** — e.g. pods within a region — rather than every individual store.
**"All Levels" is the simplest, safest setting** when you want the lowest level of that particular structure (e.g. pods) without having to separately test which specific level number corresponds to what you want.
Each region-specific report is **hard-coded to one specific dimension structure.** To stand up a new region's version: **duplicate an existing regional report, update the hard-coded dimension structure reference** to the new region, and confirm the underlying location groups already exist.
**The report itself doesn't need to be rebuilt from scratch.**
## Building a report on a dimension structure
For example a regional side-by-side:
E.g. the current-period actual-dollars column.
To split that single column by a **dimension structure** — as opposed to expanding by **time period**, which is used for reports showing multiple months across the columns instead.
Choose **Dimension Structure** when you want the report to show a **level of the hierarchy** — e.g. pods within a region — rather than every individual store.
**"All Levels" is the simplest, safest setting** when you want the lowest level of that particular structure (e.g. pods) without having to separately test which specific level number corresponds to what you want.
Each region-specific report is **hard-coded to one specific dimension structure.** To stand up a new region's version: **duplicate an existing regional report, update the hard-coded dimension structure reference** to the new region, and confirm the underlying location groups already exist.
**The report itself doesn't need to be rebuilt from scratch.**
 ## District Comparison ("DC") reports — a different report type
A small number of saved reports — identifiable by **"DC"** or **"District Compar…"** in the name — are built as **dimension-based** report structures rather than the standard **account-based** structure used everywhere else.
| Structure | Rows are |
|---|---|
| **Account-based** (standard) | Account groups |
| **Dimension-based** | Locations / dimension groups |
This choice is set on the **Report Info** tab when the report is first created.
There are only a handful of these in Rackson's report library, so this is a **minor exception to be aware of** rather than a major part of the day-to-day workflow. But if you open one and the row structure looks unfamiliar, this is why.
## Cash flow reports
There are exactly **3** cash flow reports. Cash flow GL groups are **simpler and more classical** account groupings than the income statement side.
**Mechanics:** the report starts with full net income detail, then layers in **"CF-" prefixed account groups** representing the balance-sheet-driven changes (changes in working capital accounts, and so on). It calculates a net change in cash from those groups, adds it to the beginning cash balance (itself pulled from the actual cash account group), and **solves for an ending cash balance.**
**Required check when publishing this report.** Always tie the report's calculated **ending cash back to the balance sheet summary's cash balance**, and separately confirm the calculated **net change makes sense** given the beginning and ending balances.
A miscoded entry can throw off the net change shown on the cash flow statement **without necessarily being obvious anywhere else.**
**Known limitation.** This report doesn't generate many client questions in normal periods. The one recurring exception is around **large asset dispositions**, where the client has wanted sale proceeds shown **separately** from the associated gain/loss rather than netted together. Intacct's standard report format does not support that presentation — **this has been an accepted limitation** rather than something to engineer around.
## Related
- [Intacct report guide](/internal/customers/rackson/reference/intacct-report-guide) — the full 154-report listing
- [Intacct account groups](/internal/customers/rackson/reference/intacct-account-groups) — the complete GL group hierarchies
- [Intacct location groups](/internal/customers/rackson/reference/intacct-location-groups) — every group and dimension structure
- [Report distribution and scheduling](/internal/customers/rackson/review-process/report-distribution) — how these reports get delivered
- [P&L review process](/internal/customers/rackson/review-process/pl-review) — the reports in use
## District Comparison ("DC") reports — a different report type
A small number of saved reports — identifiable by **"DC"** or **"District Compar…"** in the name — are built as **dimension-based** report structures rather than the standard **account-based** structure used everywhere else.
| Structure | Rows are |
|---|---|
| **Account-based** (standard) | Account groups |
| **Dimension-based** | Locations / dimension groups |
This choice is set on the **Report Info** tab when the report is first created.
There are only a handful of these in Rackson's report library, so this is a **minor exception to be aware of** rather than a major part of the day-to-day workflow. But if you open one and the row structure looks unfamiliar, this is why.
## Cash flow reports
There are exactly **3** cash flow reports. Cash flow GL groups are **simpler and more classical** account groupings than the income statement side.
**Mechanics:** the report starts with full net income detail, then layers in **"CF-" prefixed account groups** representing the balance-sheet-driven changes (changes in working capital accounts, and so on). It calculates a net change in cash from those groups, adds it to the beginning cash balance (itself pulled from the actual cash account group), and **solves for an ending cash balance.**
**Required check when publishing this report.** Always tie the report's calculated **ending cash back to the balance sheet summary's cash balance**, and separately confirm the calculated **net change makes sense** given the beginning and ending balances.
A miscoded entry can throw off the net change shown on the cash flow statement **without necessarily being obvious anywhere else.**
**Known limitation.** This report doesn't generate many client questions in normal periods. The one recurring exception is around **large asset dispositions**, where the client has wanted sale proceeds shown **separately** from the associated gain/loss rather than netted together. Intacct's standard report format does not support that presentation — **this has been an accepted limitation** rather than something to engineer around.
## Related
- [Intacct report guide](/internal/customers/rackson/reference/intacct-report-guide) — the full 154-report listing
- [Intacct account groups](/internal/customers/rackson/reference/intacct-account-groups) — the complete GL group hierarchies
- [Intacct location groups](/internal/customers/rackson/reference/intacct-location-groups) — every group and dimension structure
- [Report distribution and scheduling](/internal/customers/rackson/review-process/report-distribution) — how these reports get delivered
- [P&L review process](/internal/customers/rackson/review-process/pl-review) — the reports in use